flowchart LR
  m[Metric Collector]
  i[Incident Detection System]
  a[Alarm Generator]
  e[DevOps Engineer]
  m --> |metric data points| i --> |incidents| a --> |notifications| e
Context
Anomalies are data points that are very different from the vast majority of the other data that is being analysed. Anomaly detection is the class of algorithms responsible for detecting the anomalies based on some programmed criteria.

Anomaly detection is used in different problem domains such as:
- Financial Fraud
- Manufacturing Inspection
- Network Intrusion Detection
- Web Service Disaster Discovery
But other problem domains as well.
DevOps Use Case
One common use is in the DevOps activities.
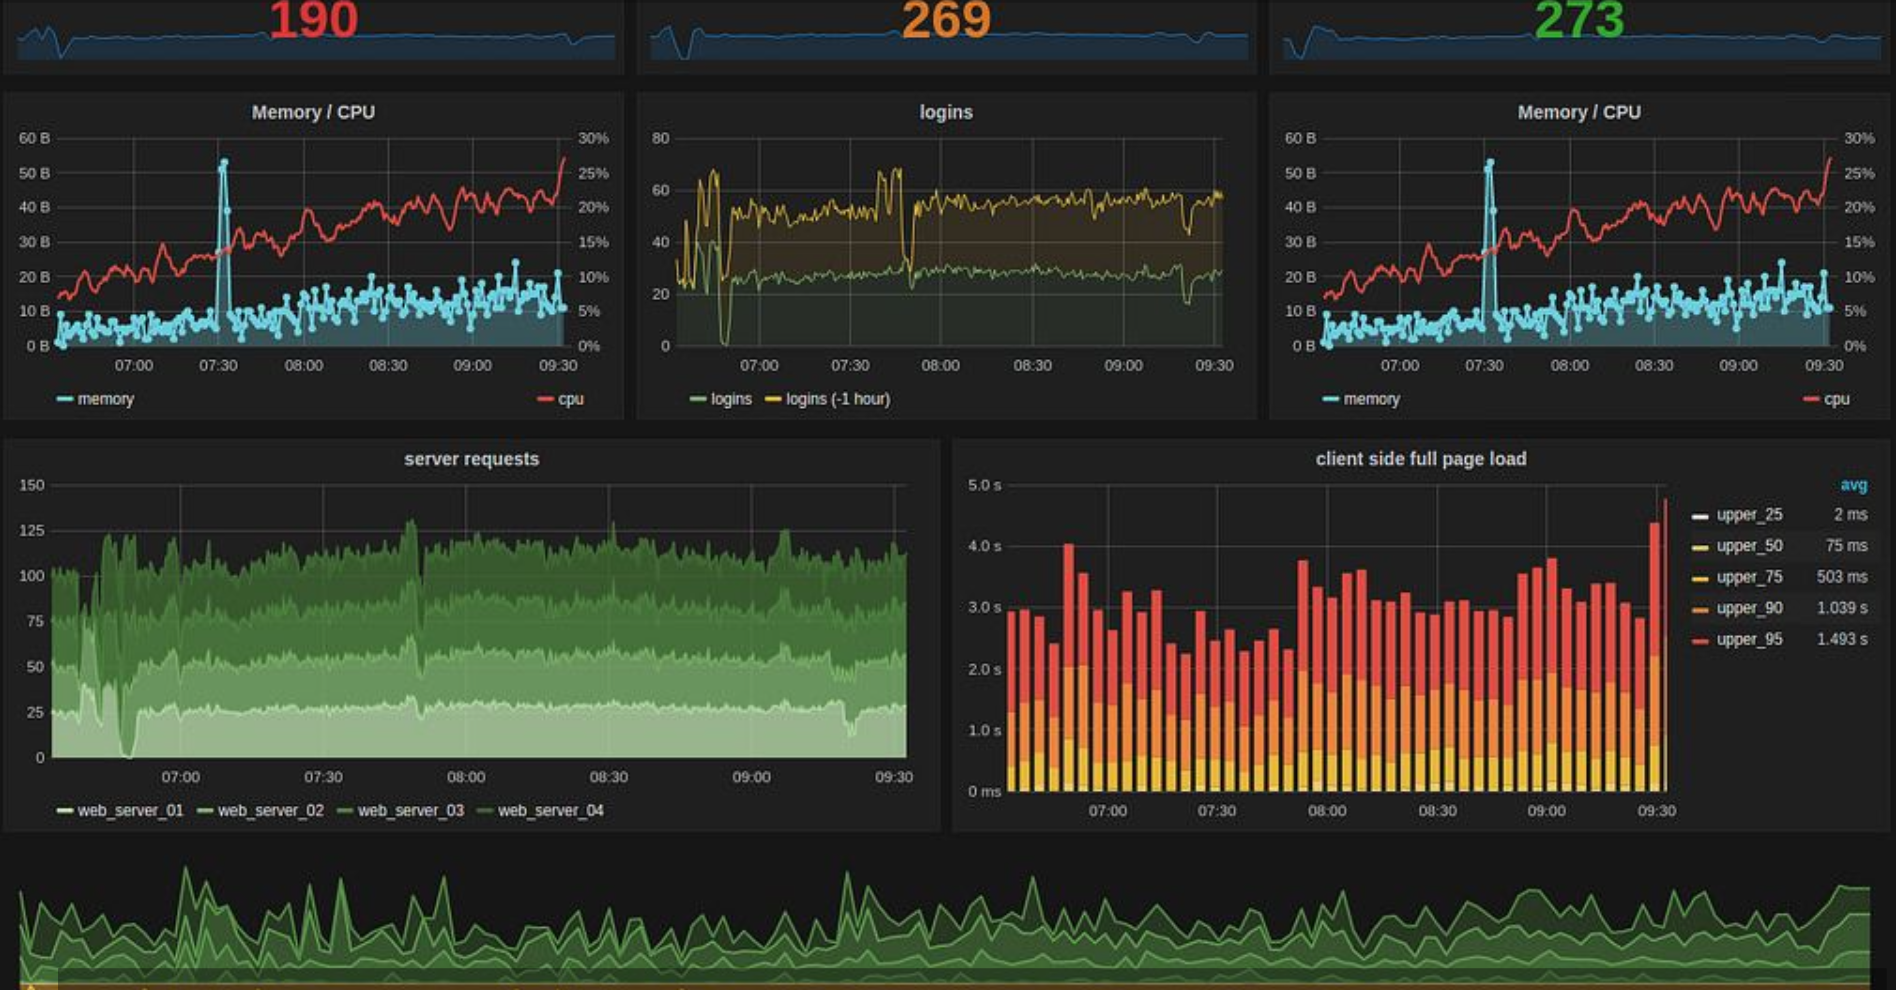
In DevOps activities, machines are monitored through graphic analysis of CPU levels, memory consumption, several metrics levels, etc.

However relying on human eyes to look at dashboards is not a scalable option when there are almost a hundred of metrics.
Therefore, some type of automation is needed!
An automated metric alarm system could be built as shown below:
Depending on the anomaly detection use case, this activity could be less or more complicated.
Use Case 1 - Linear Distribution
Let’s suppose there is a metric that counts how many times a machine is rebooting.

In this case, machines that reboot too much are anomalies of interest.
How to isolate them?
For that, a simple approach is to use a linear threshold to isolate anomalies.
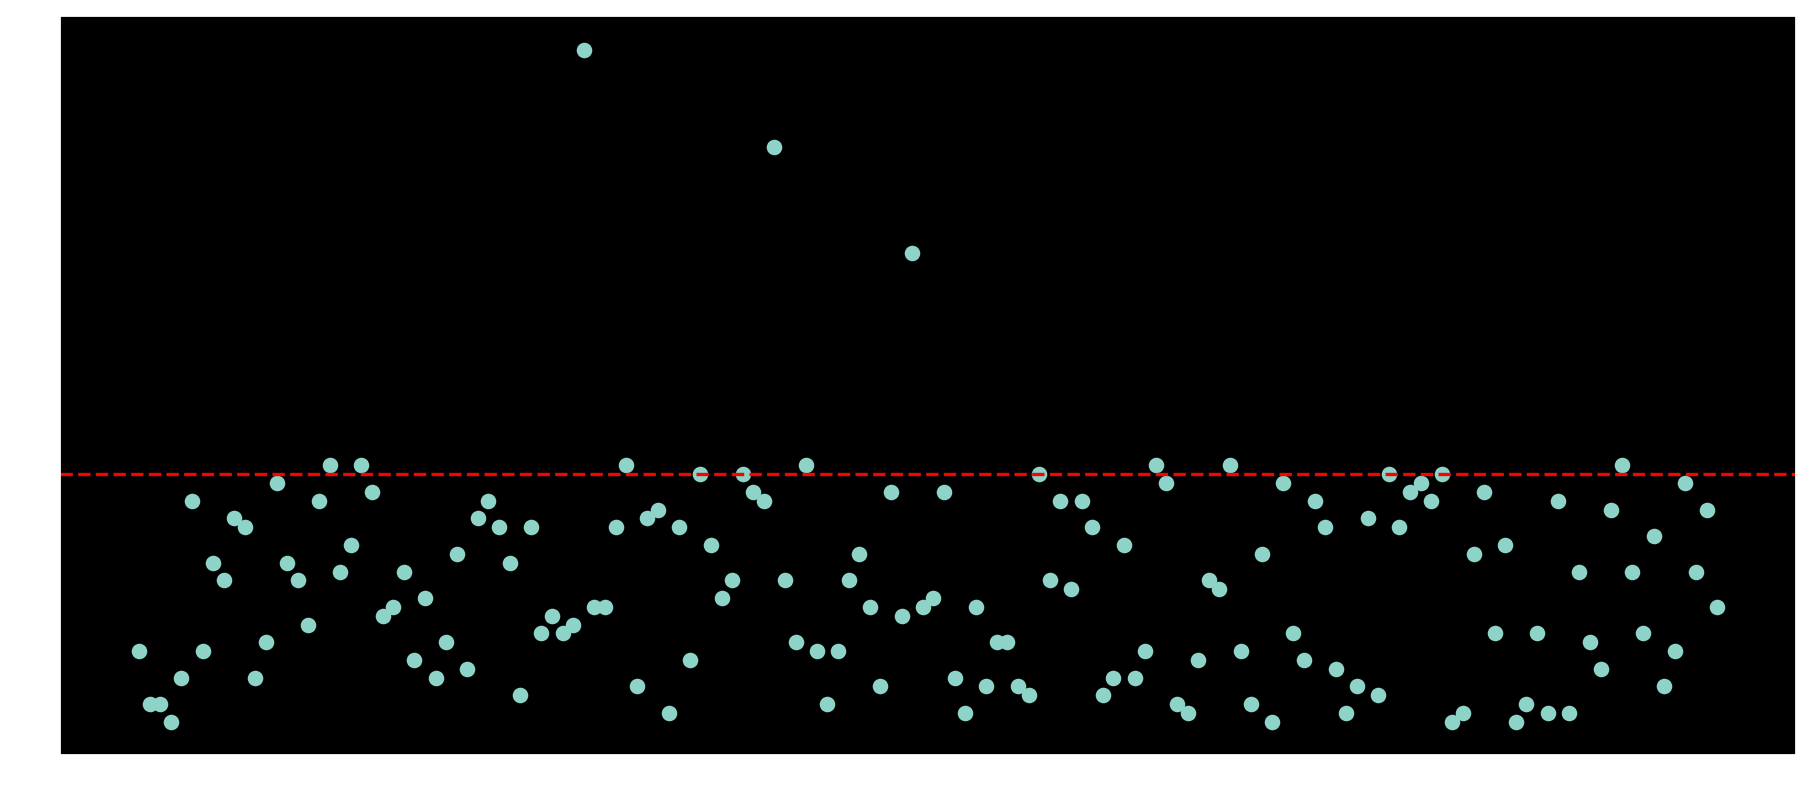
Based on median and mad as intervals could be enough to isolate anomalous machines with too many reboots after the upper limit.
The upper limit of median + 2 * mad could be used as a threshold for this case.
That was quite straight-forward, let’s see another case .
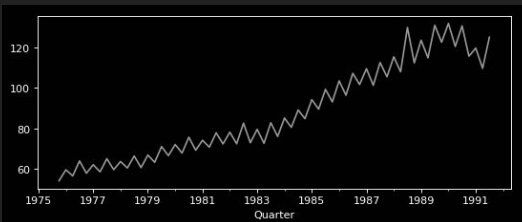
Use Case 2 - Seasonal Distributions
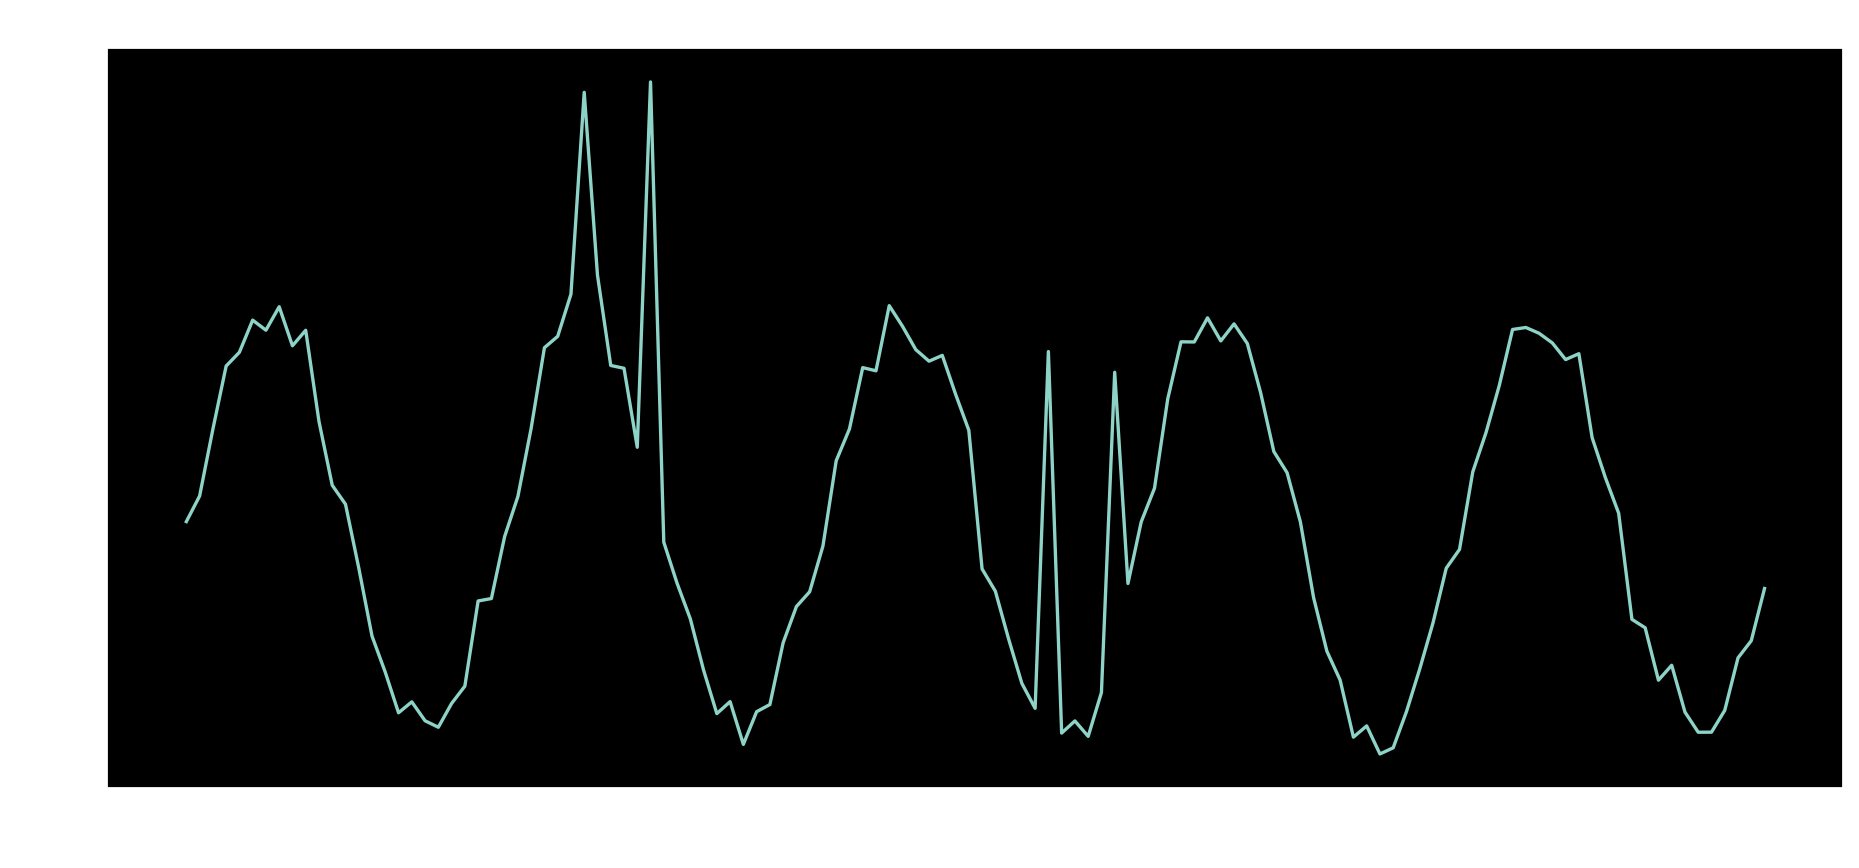
When monitoring the number of requests being made to a service during a couple days, typically a signal with the following pattern would be found.
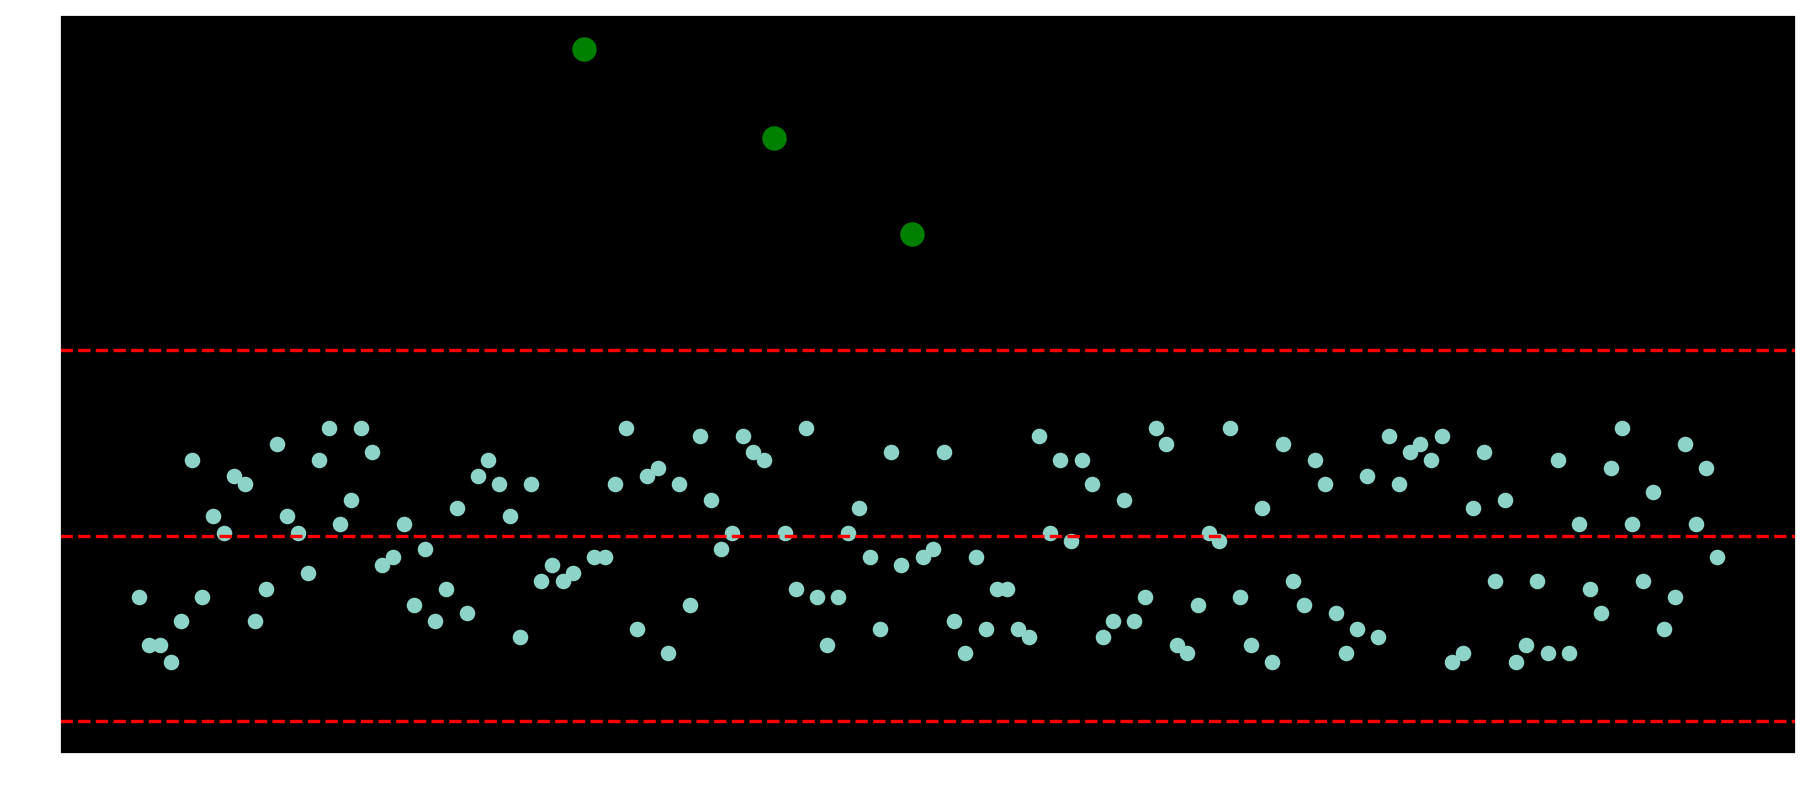
When trying to apply a linear-based threshold, it might be possible to detect global anomalies since they are very different from the others.
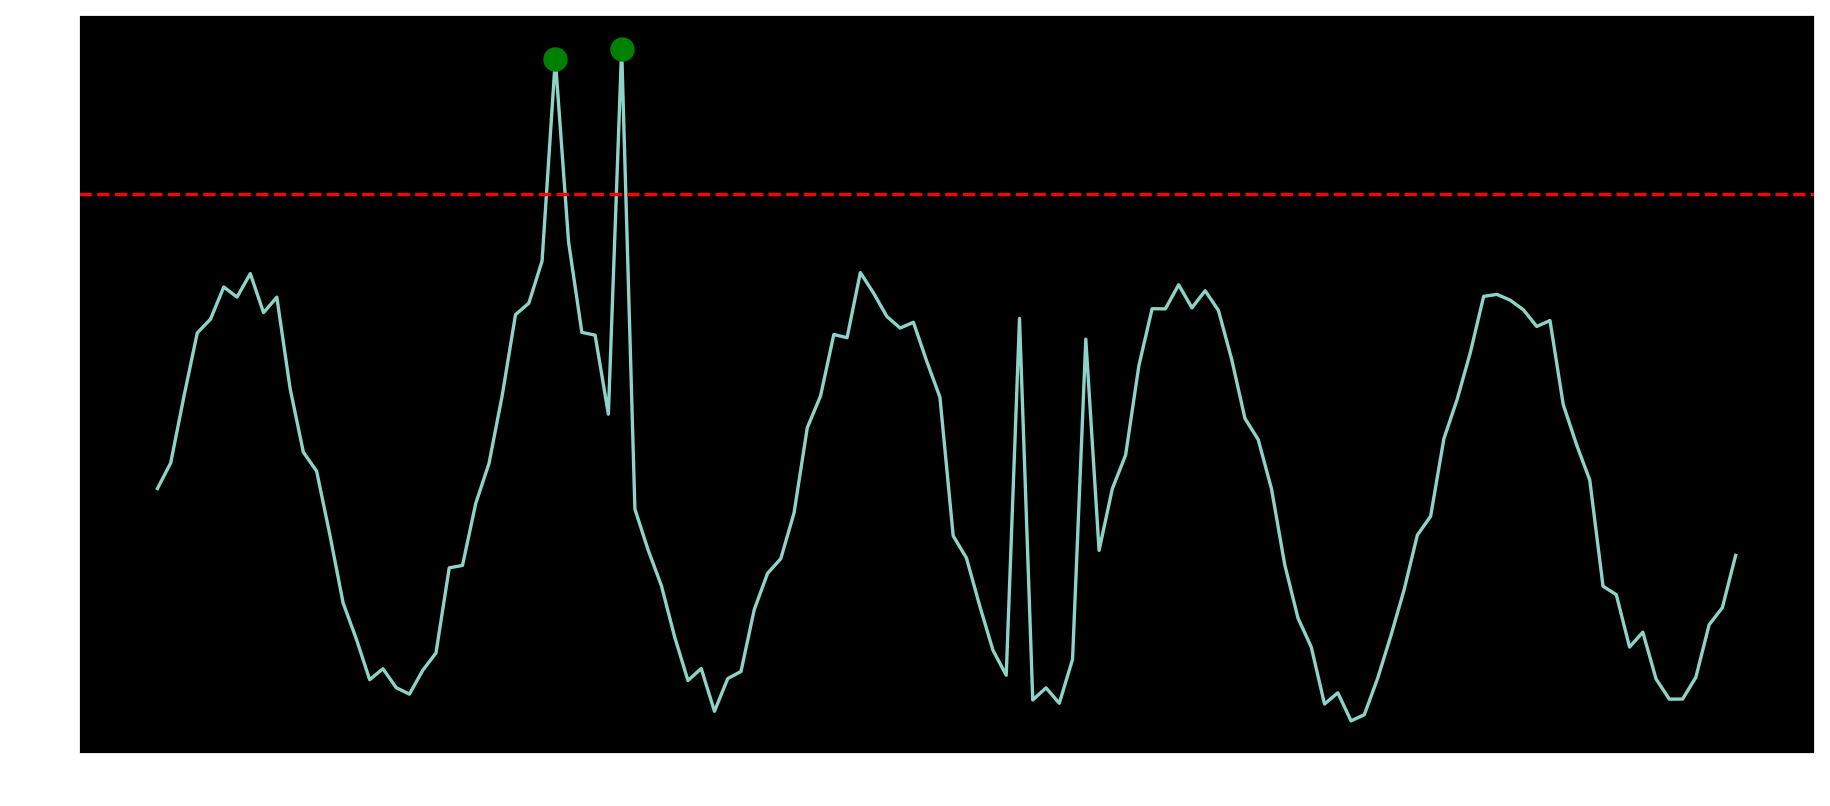
On the other hand, there are anomalies that happen inside the range of the signal but are still not expected for the given moment in the timeseries.
How to proceed to detect those local anomalies ?

That is the scope of this article.
Seasonal-Trend Decomposition
In order to capture those anomalies, it is necessary to review the signal characteristics such as seasonality, frequency and presence of long-term trend.
Seasonality could be daily, frequency is how often the datapoints are provided such as 1 per hour and the trend is expressed as a long-term inclination of the graph.
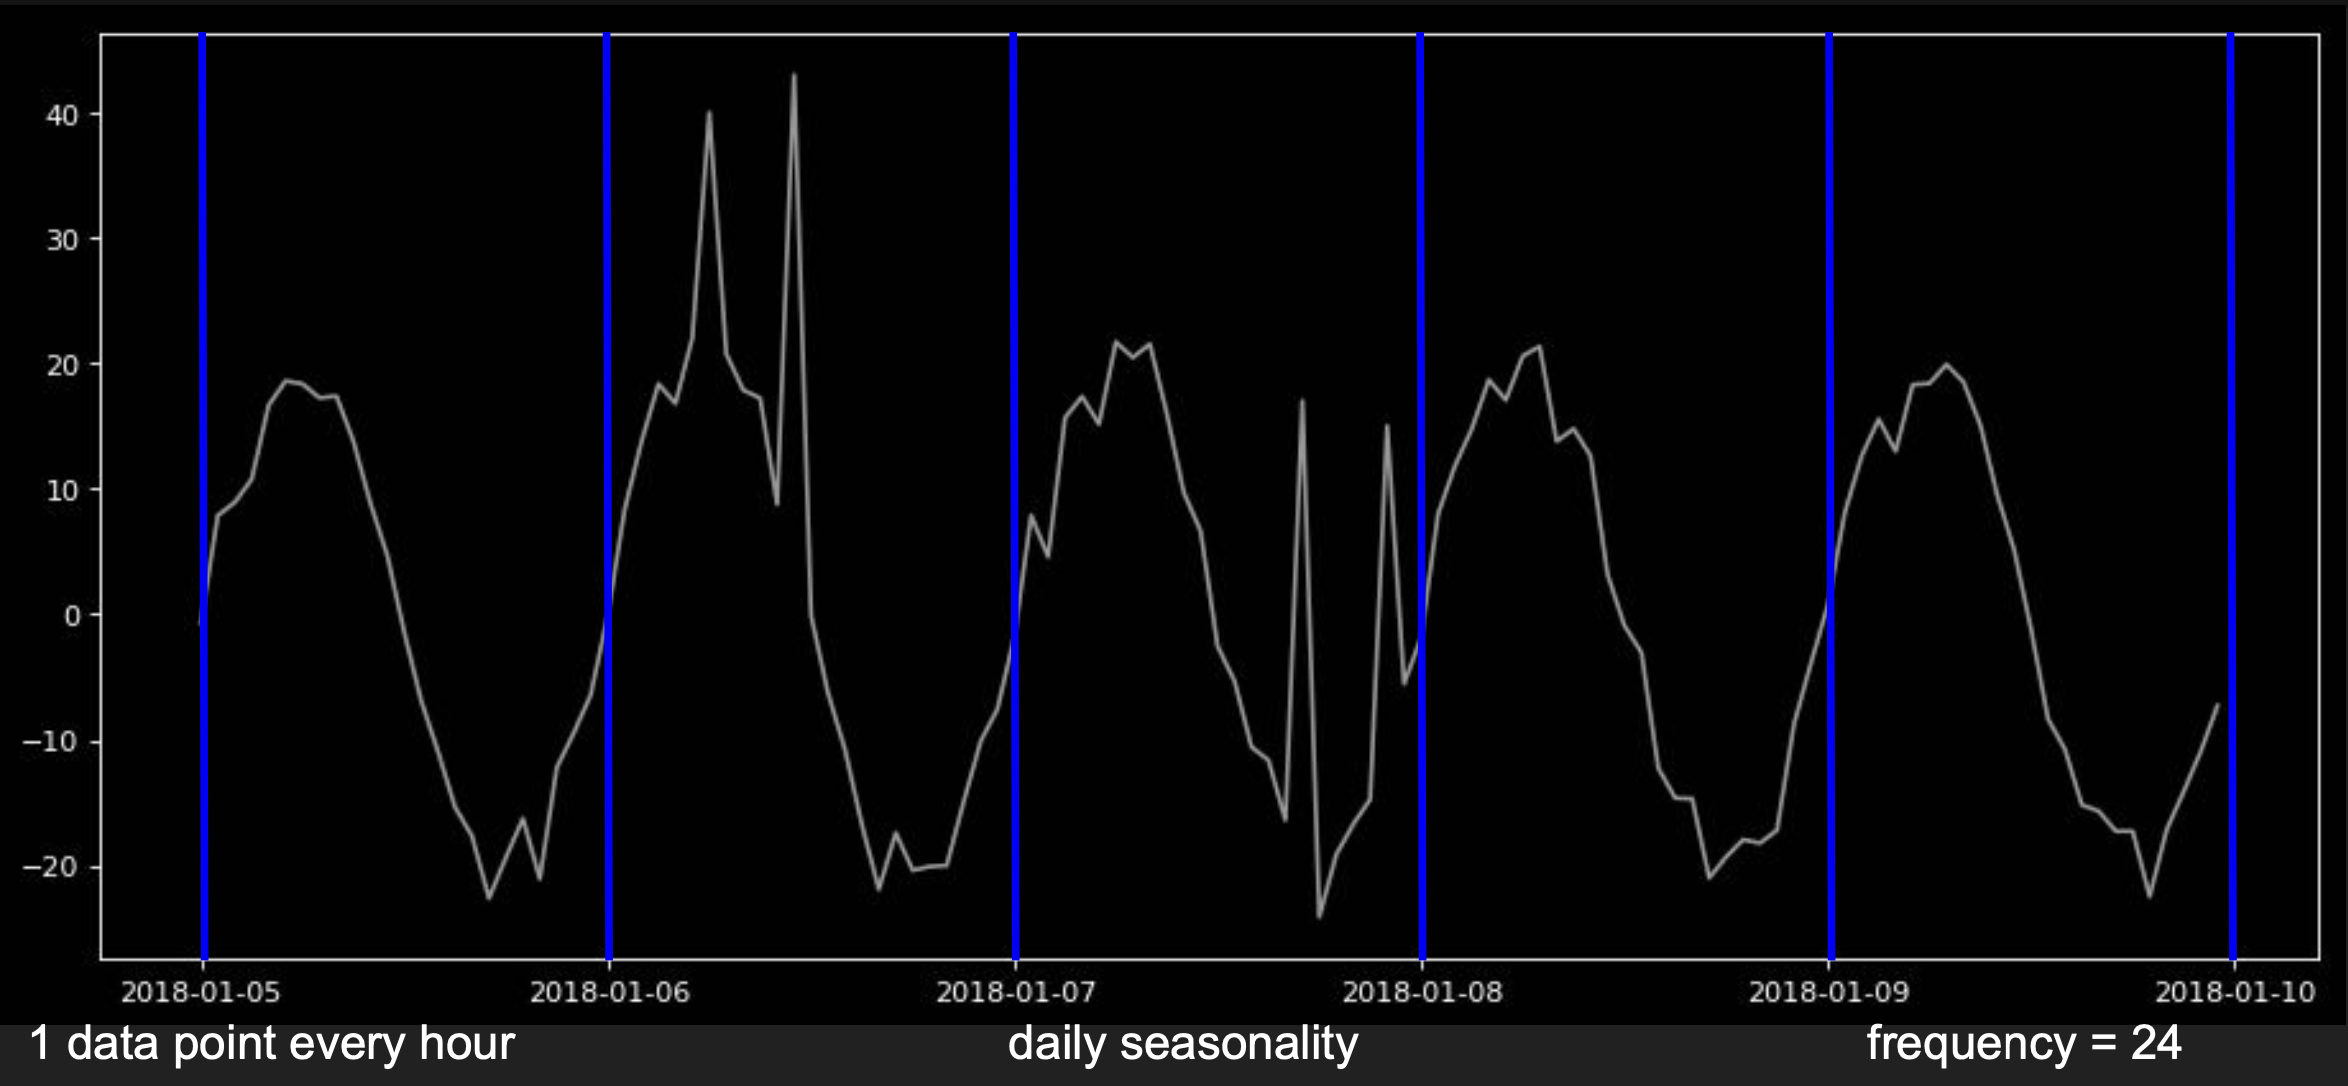
Frequency here is 24 hrs.
Besides that it is also important to understand if the signal variation increases with trend or if it remains the same.
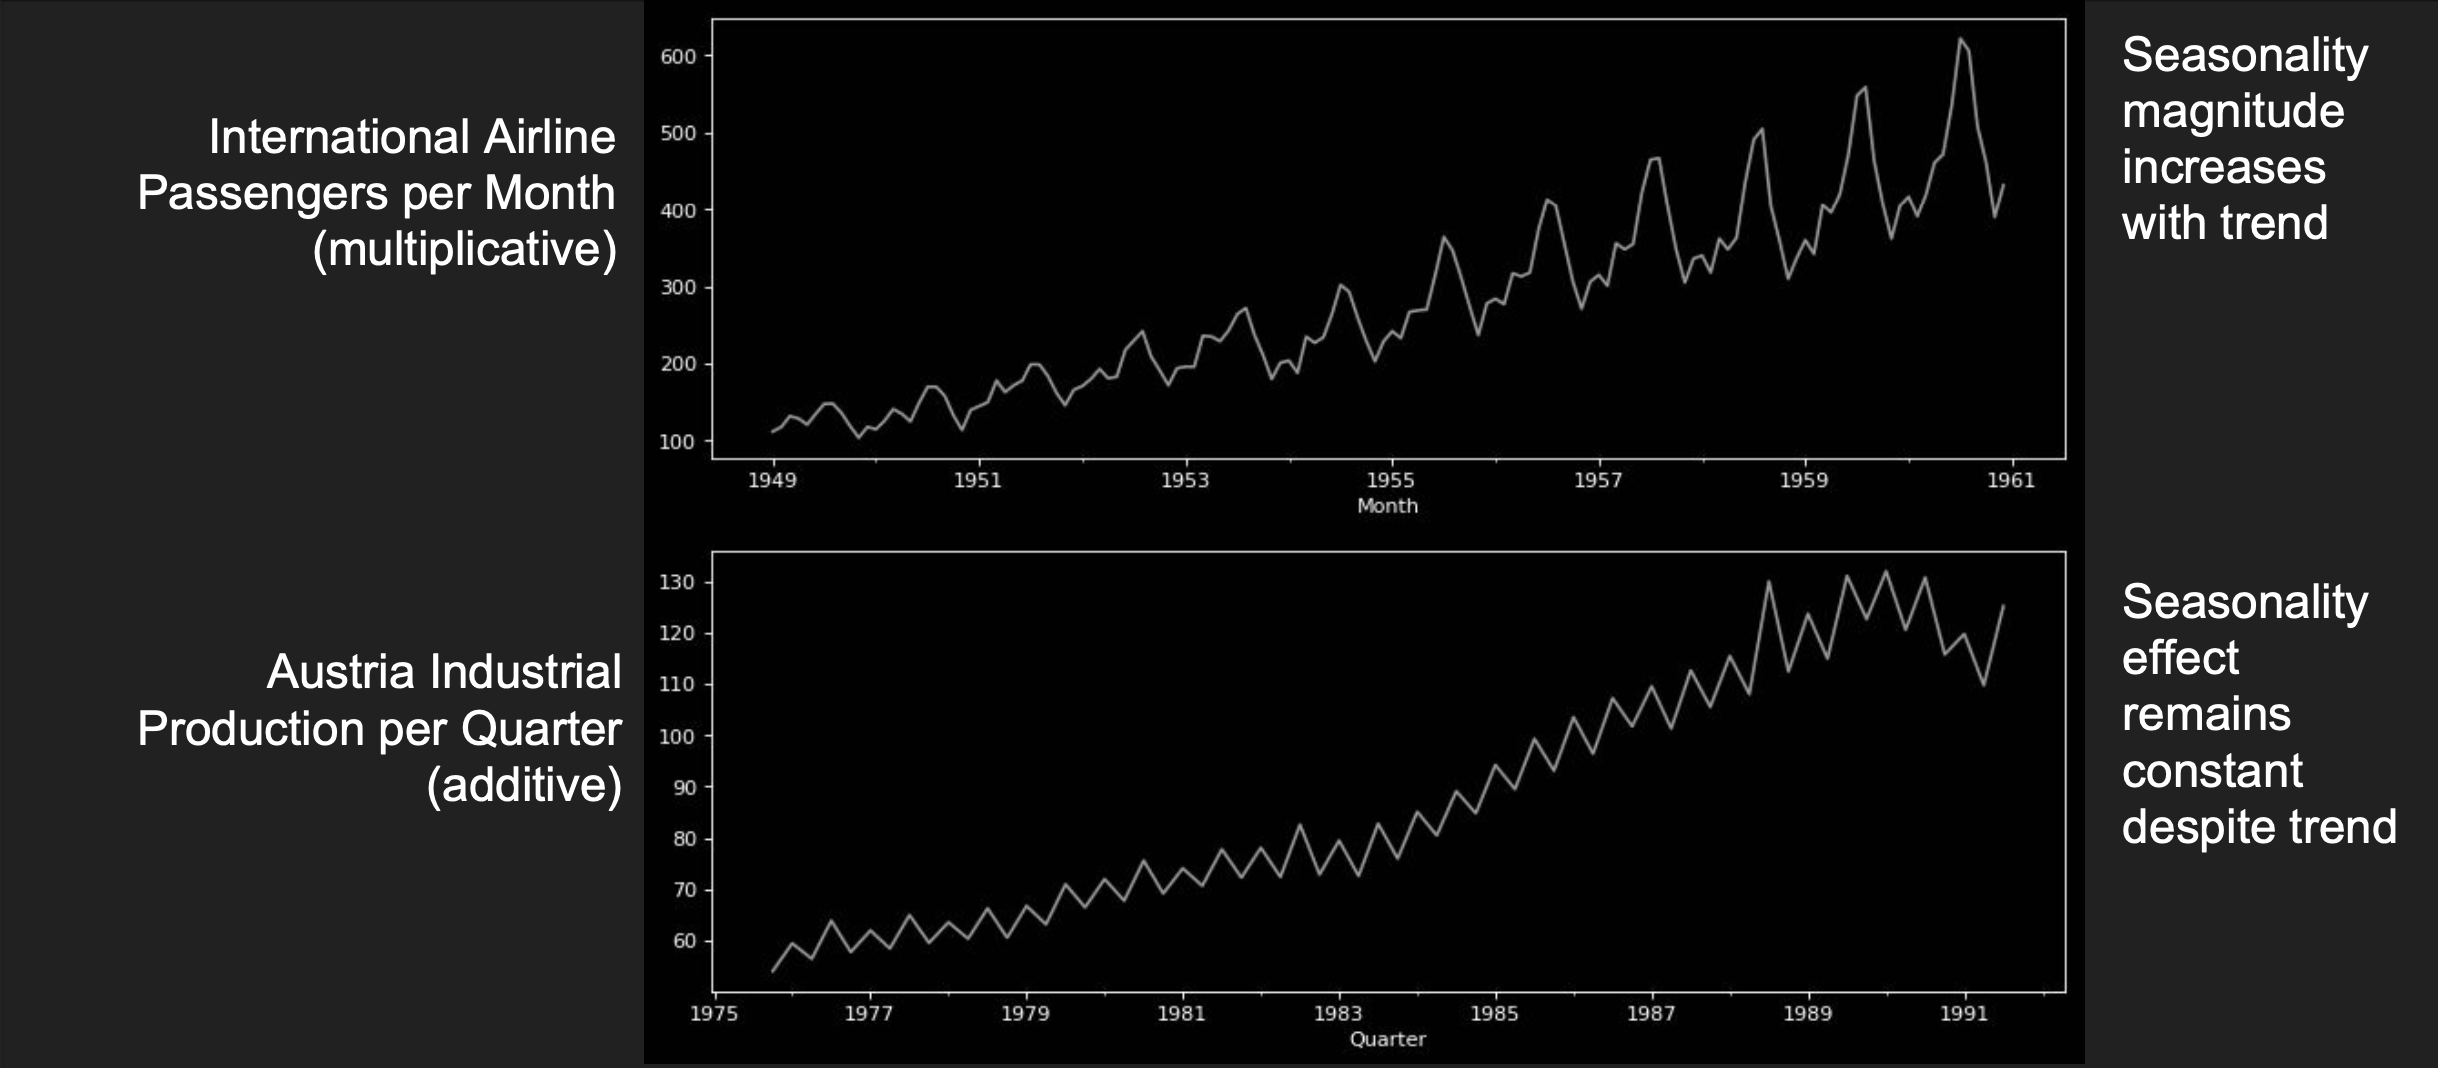
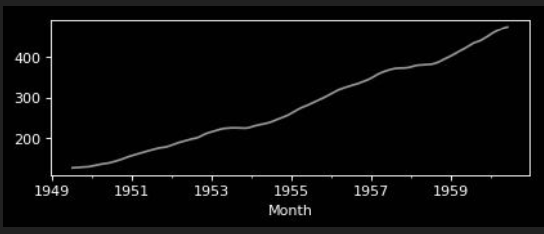
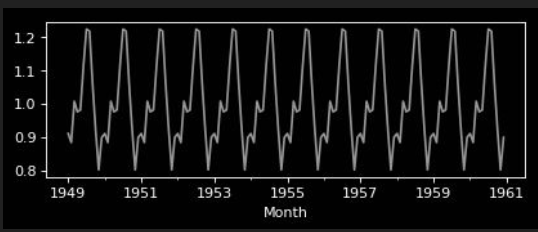
Additive vs Multiplicative Time Series
Timeseries properties change can follow an additive or multiplicative behavior.
Consider the examples below:
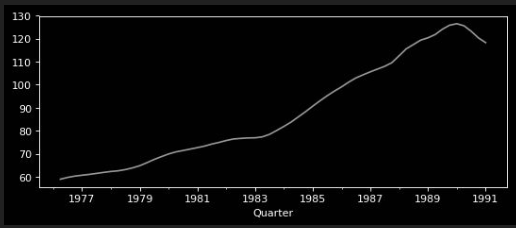
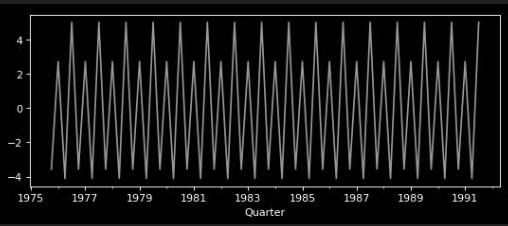
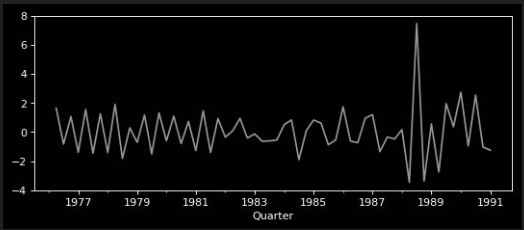
the timeseries above can be decomposed into the following timeseries:
- trend - long term signal behavior
- seasonal - identified repetitive behavior
- residual - all the rest that doesn’t fit the trend or seasonal
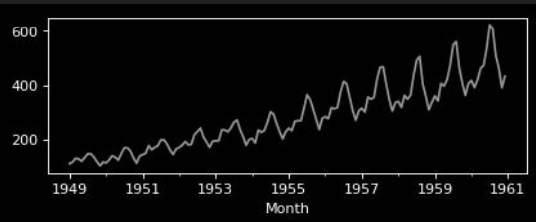
Multiplicative Model
Seasonal Trend Decomposition
| observed | = | trend | * | seasonal | * | residuals |
|---|---|---|---|---|---|---|
 |
 |
 |
 |
Additive Model
| observed | = | trend | + | seasonal | + | residuals |
|---|---|---|---|---|---|---|
 |
 |
 |
 |
Coming back to Use Case 2
Given all thatm how to capture the local anomalies in that type of seasonal timeseries ?
The \(frequency = 24\), 24 datapoints per day, 1 datapoint per hour.
The behaviour seems to be additive.
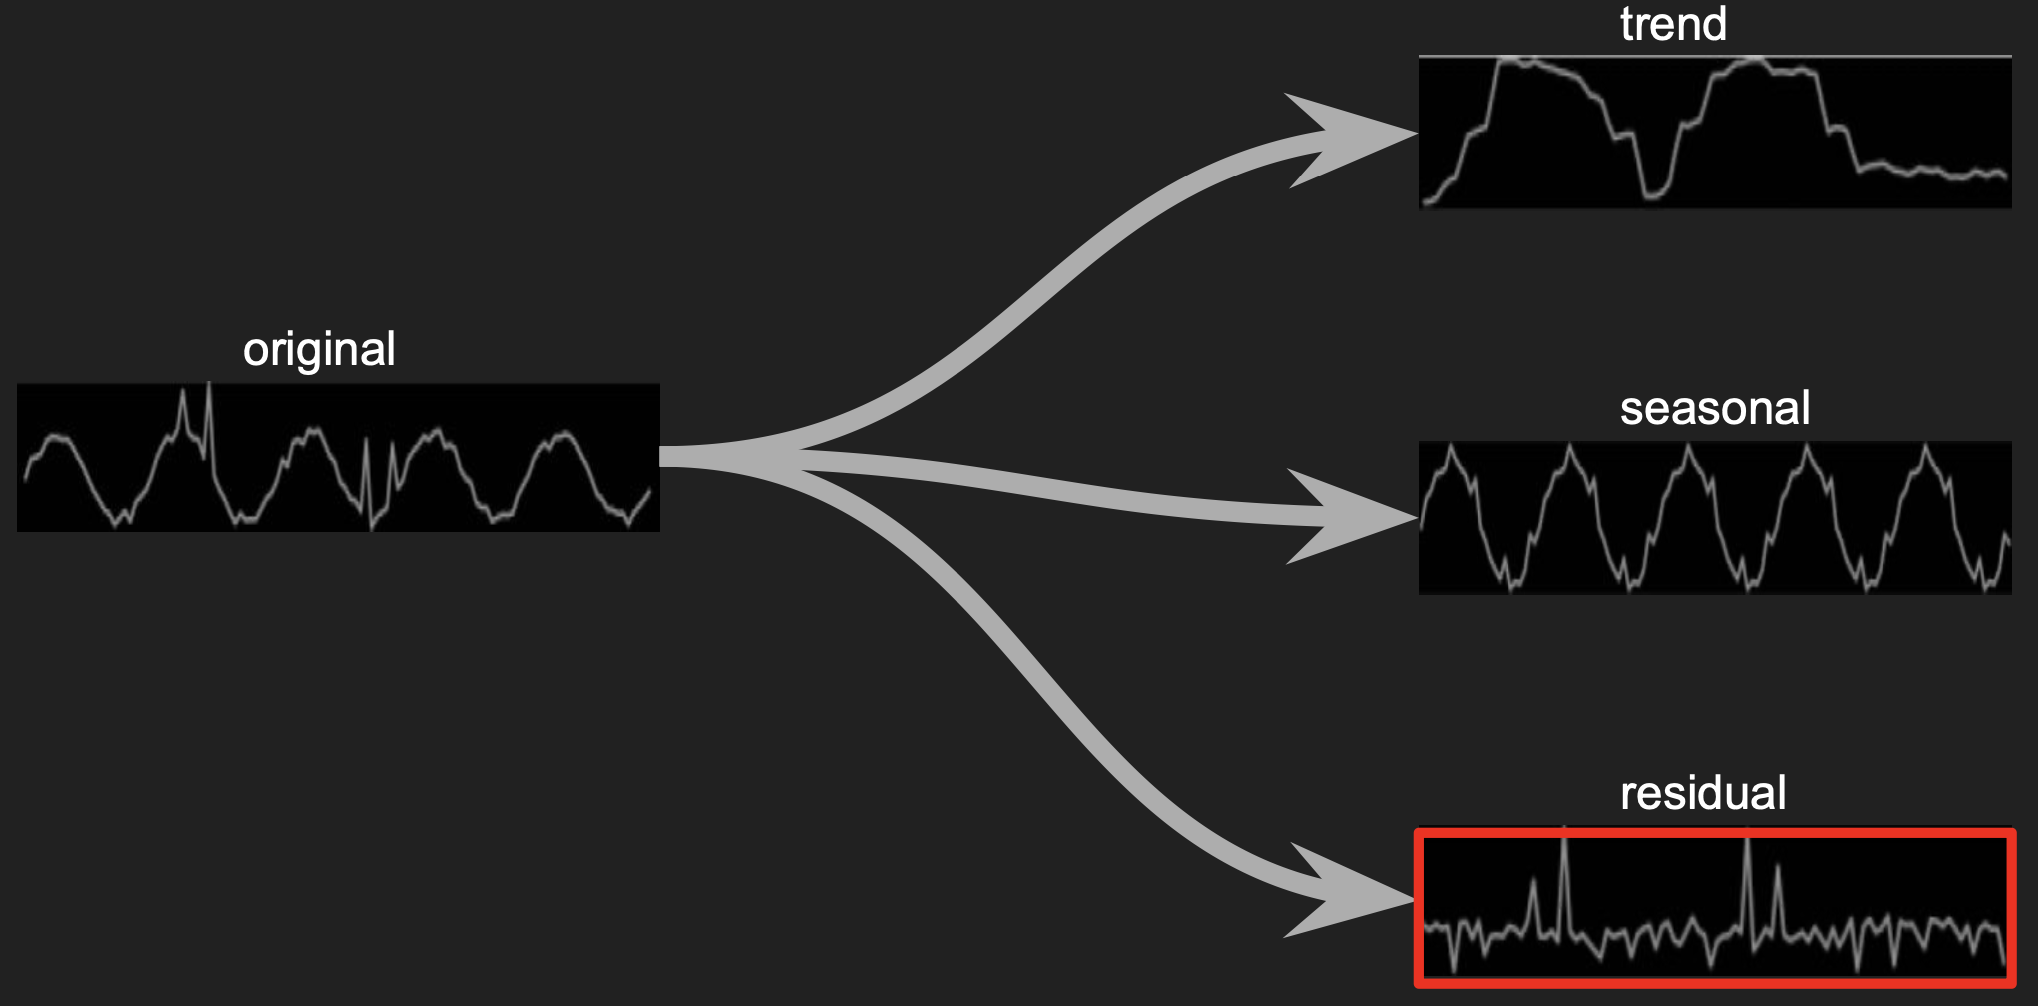
Signal Decomposition
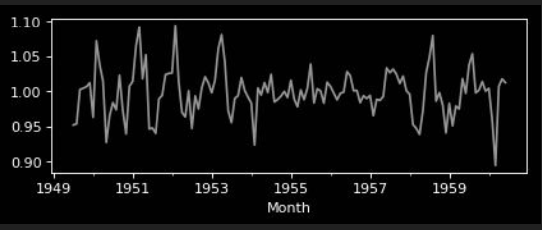
Signal must be decomposed so each part can be analysed separately.
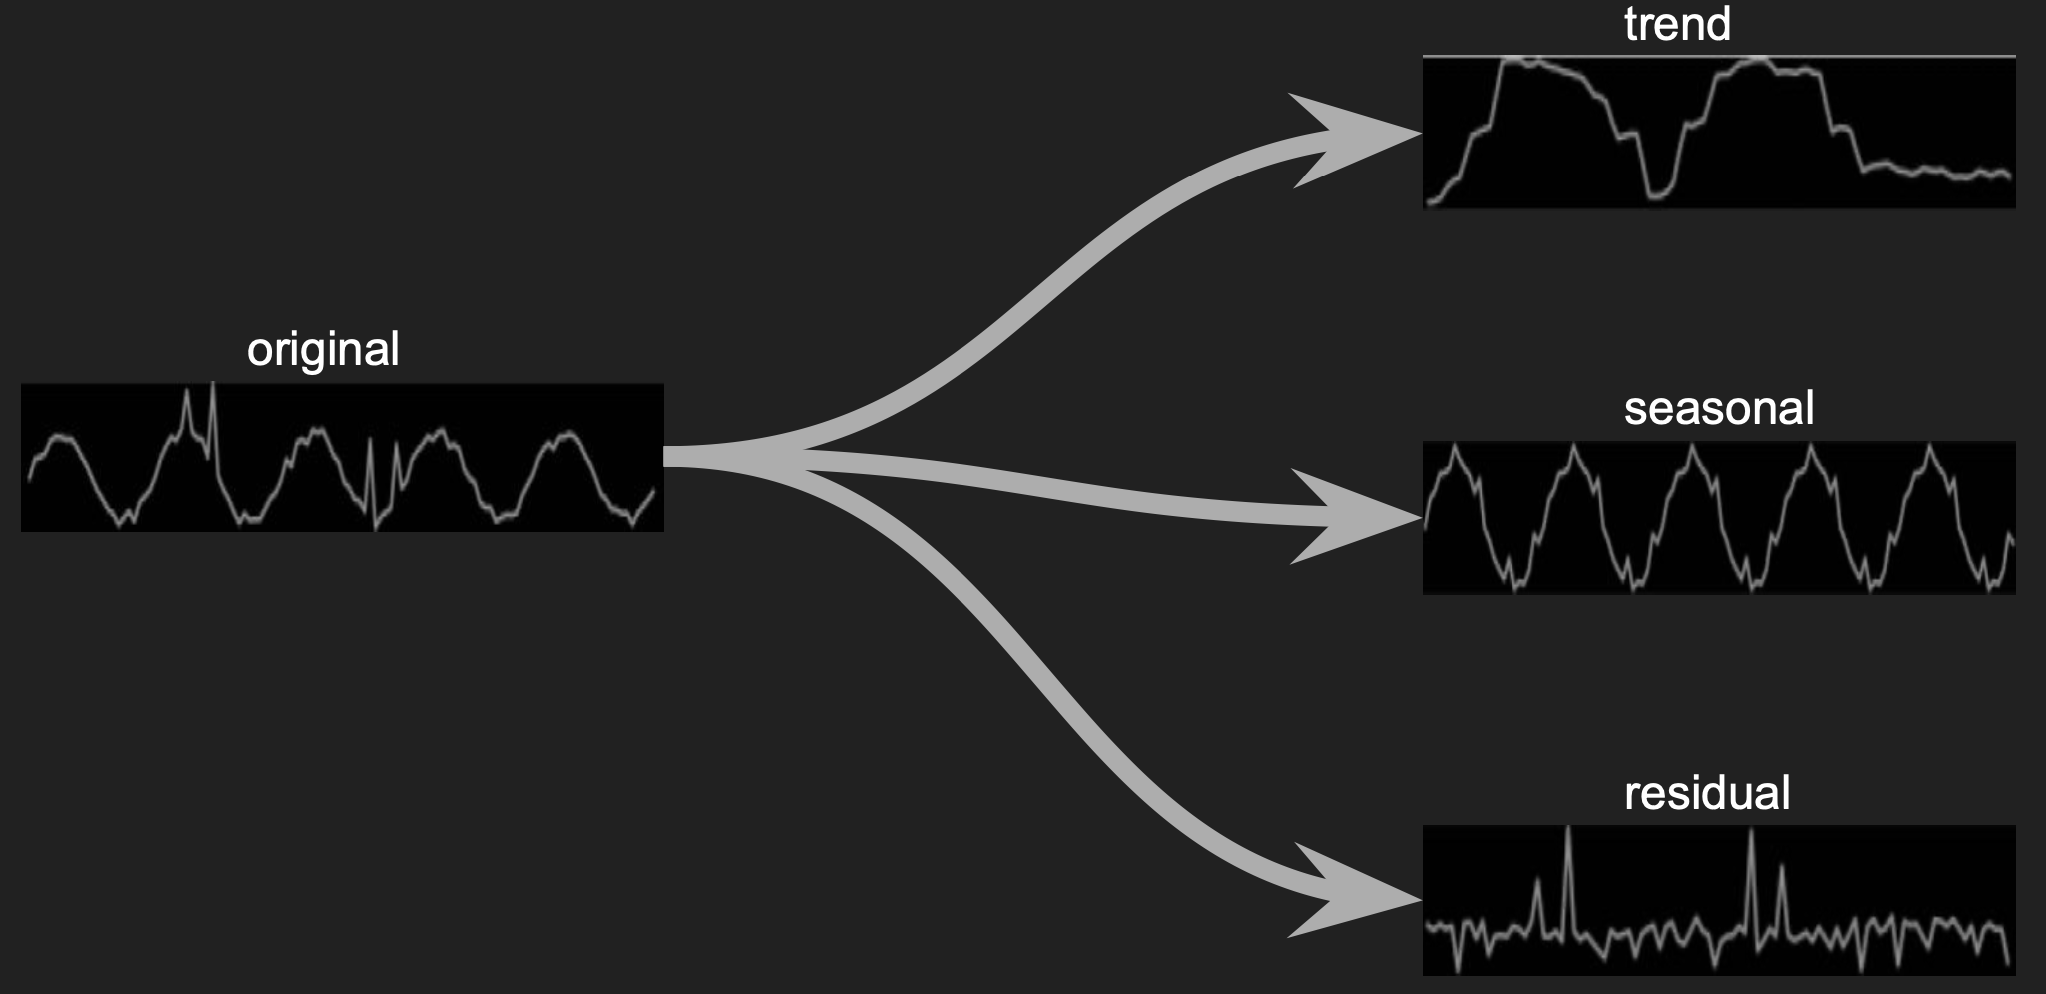
Specifically, the residual which is free from the trend and seasonality information becomes the component of interest in anonmaly detection.
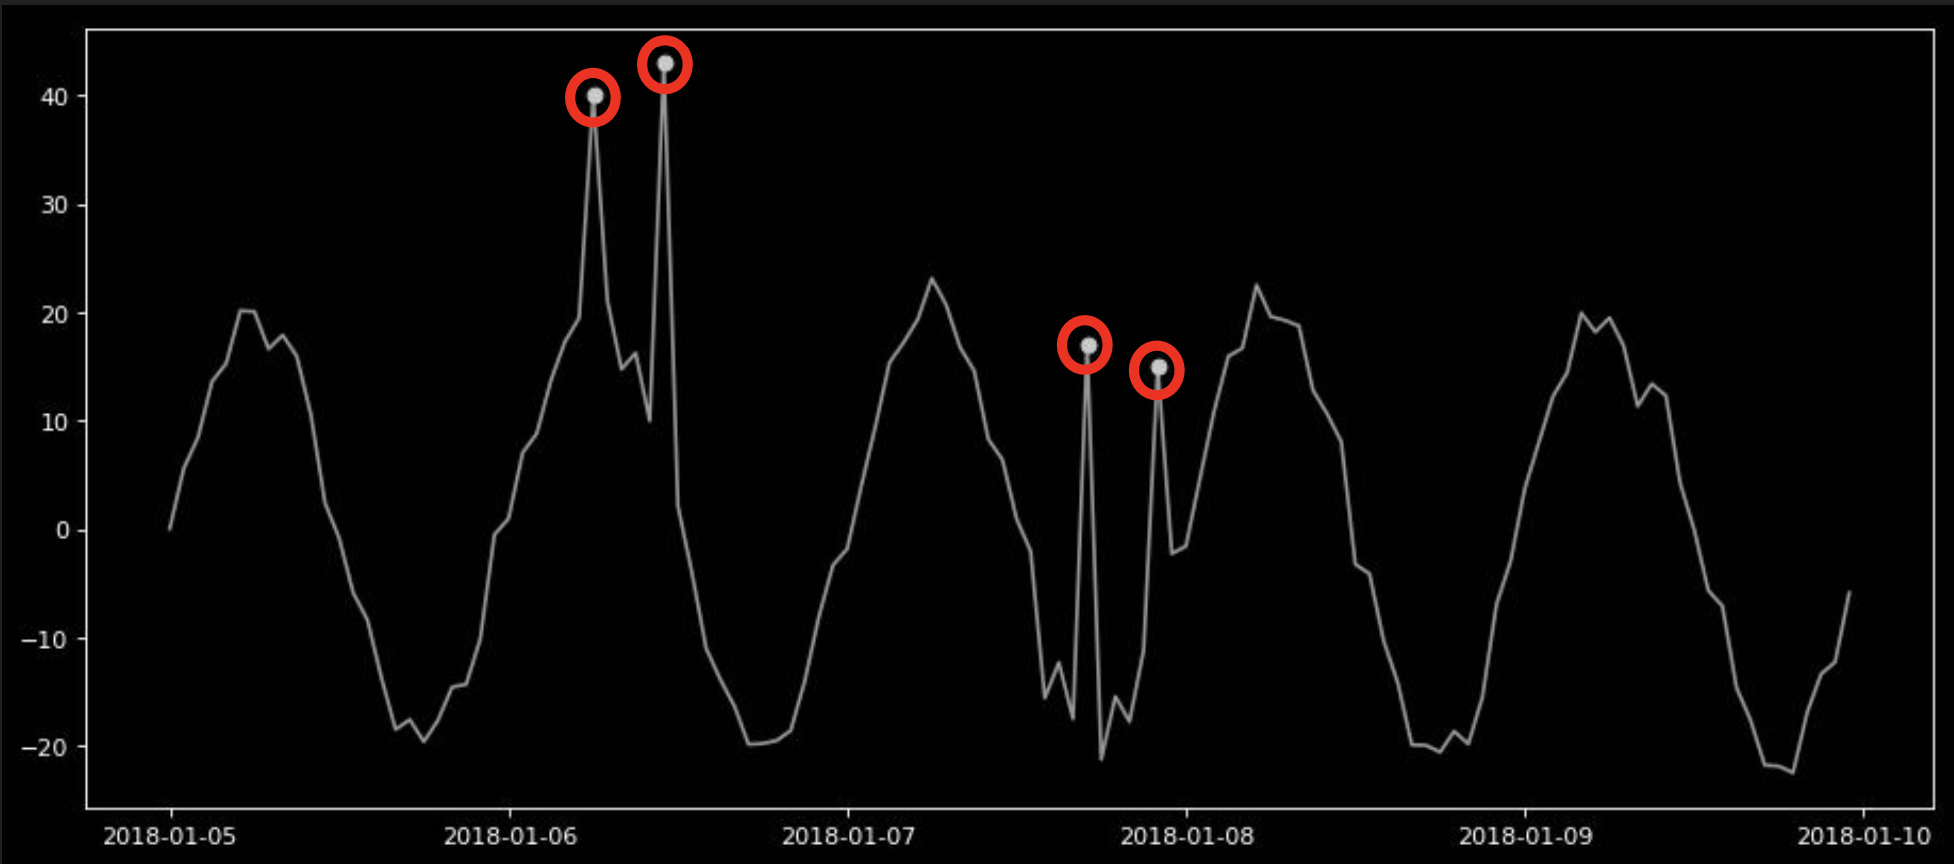
After that by comparing the original signal with the residual, it becomes apparent where the anomalies are even those inside the typical signal range.
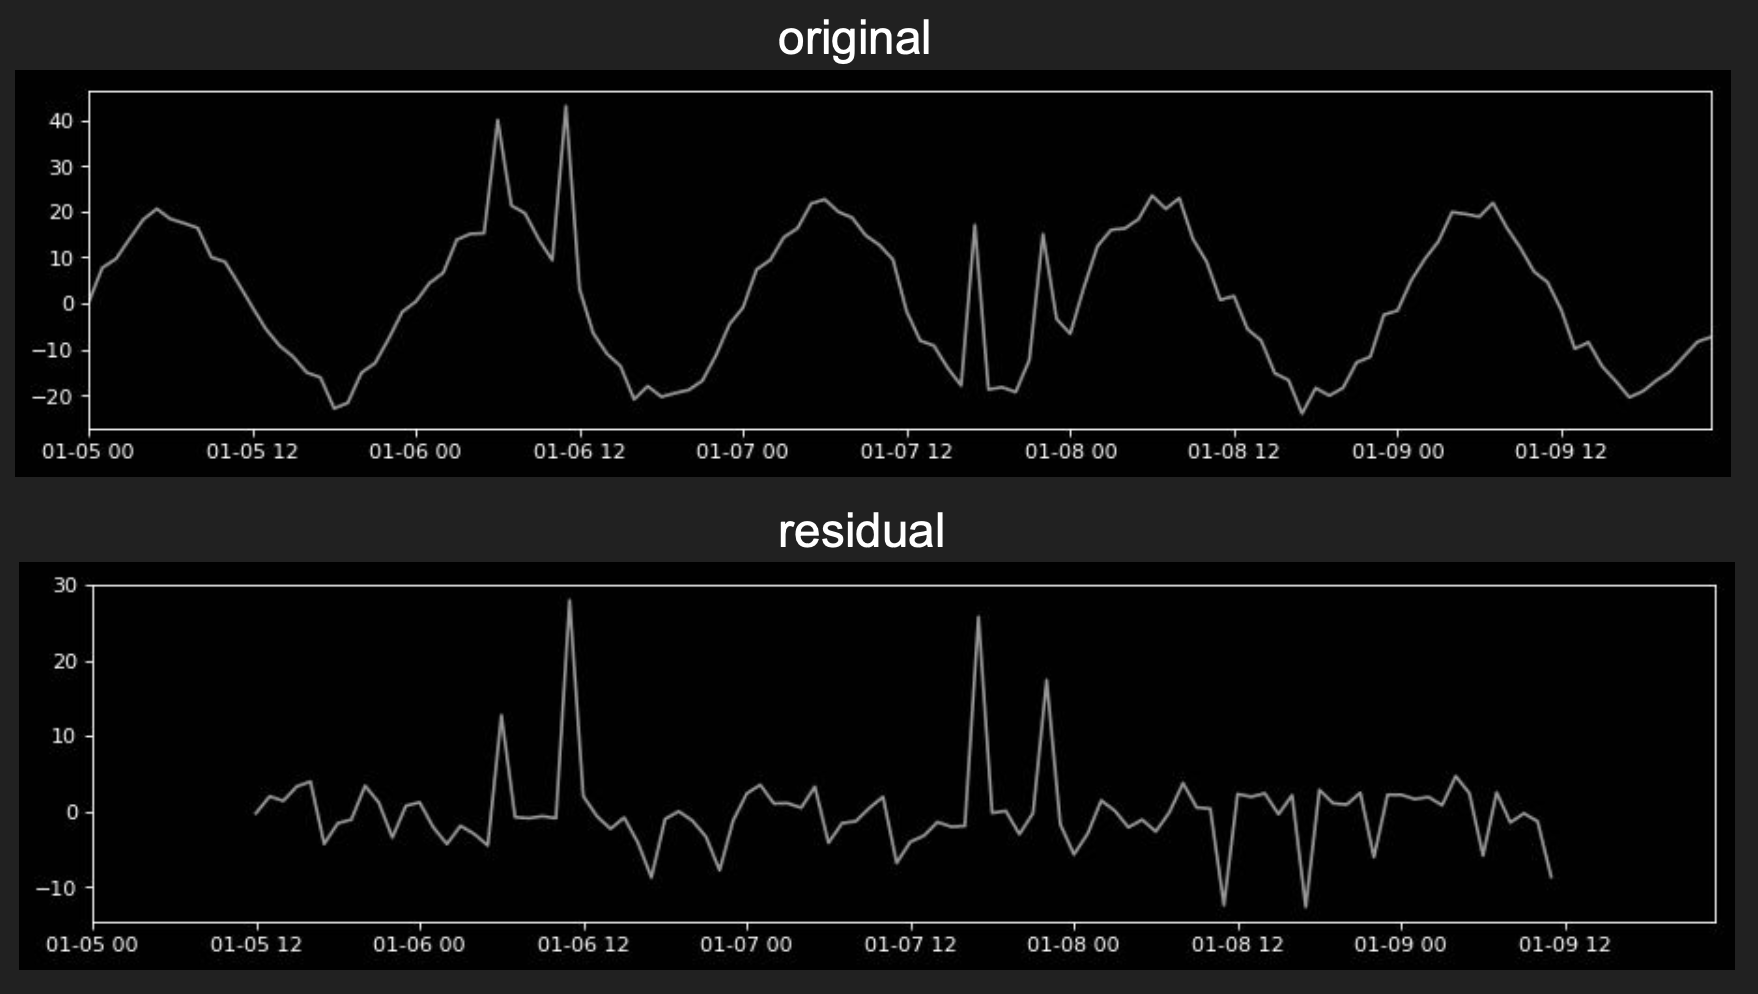
Global and local anomalies are mapped in the residual component.
Considering only, the extracted residual signal.
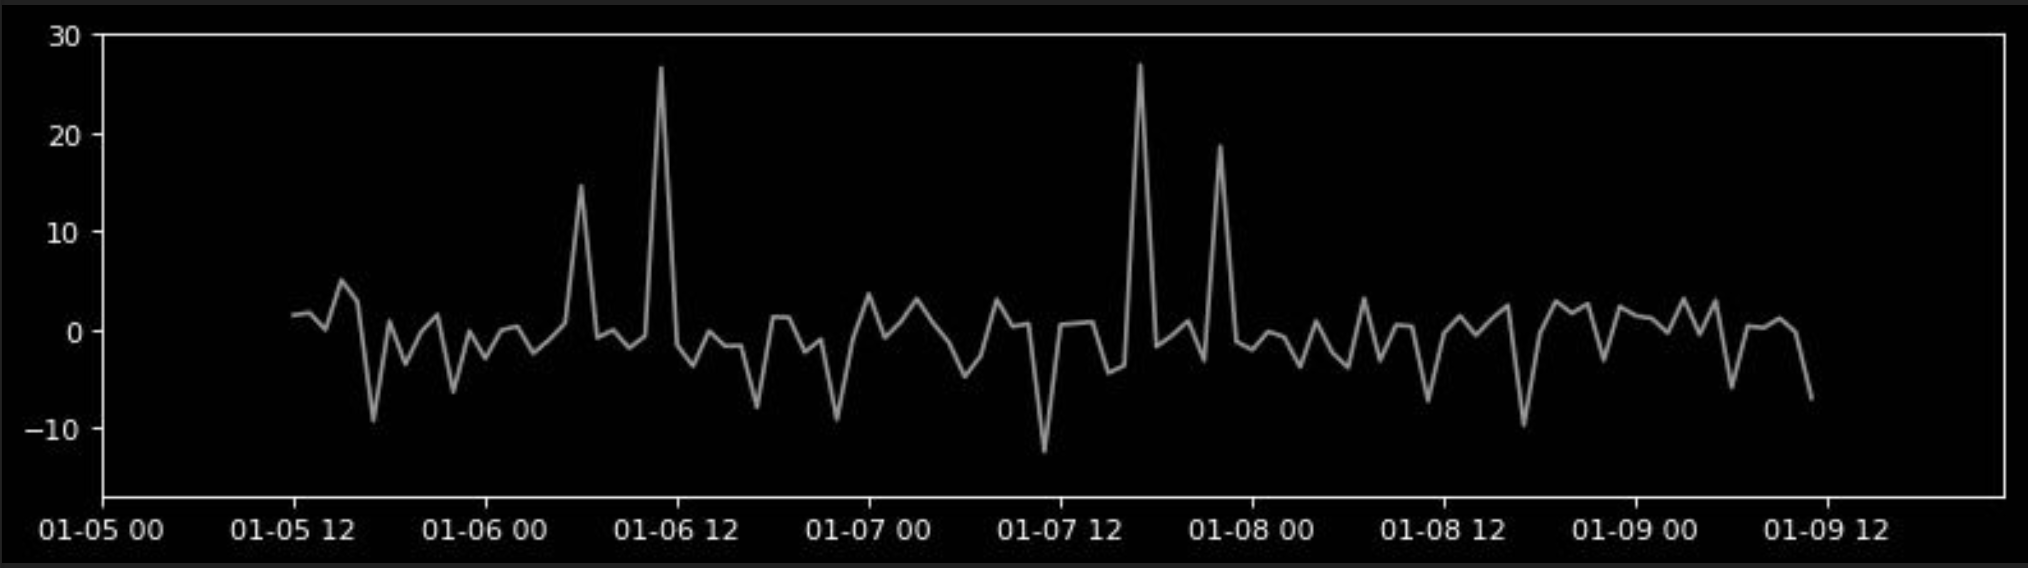
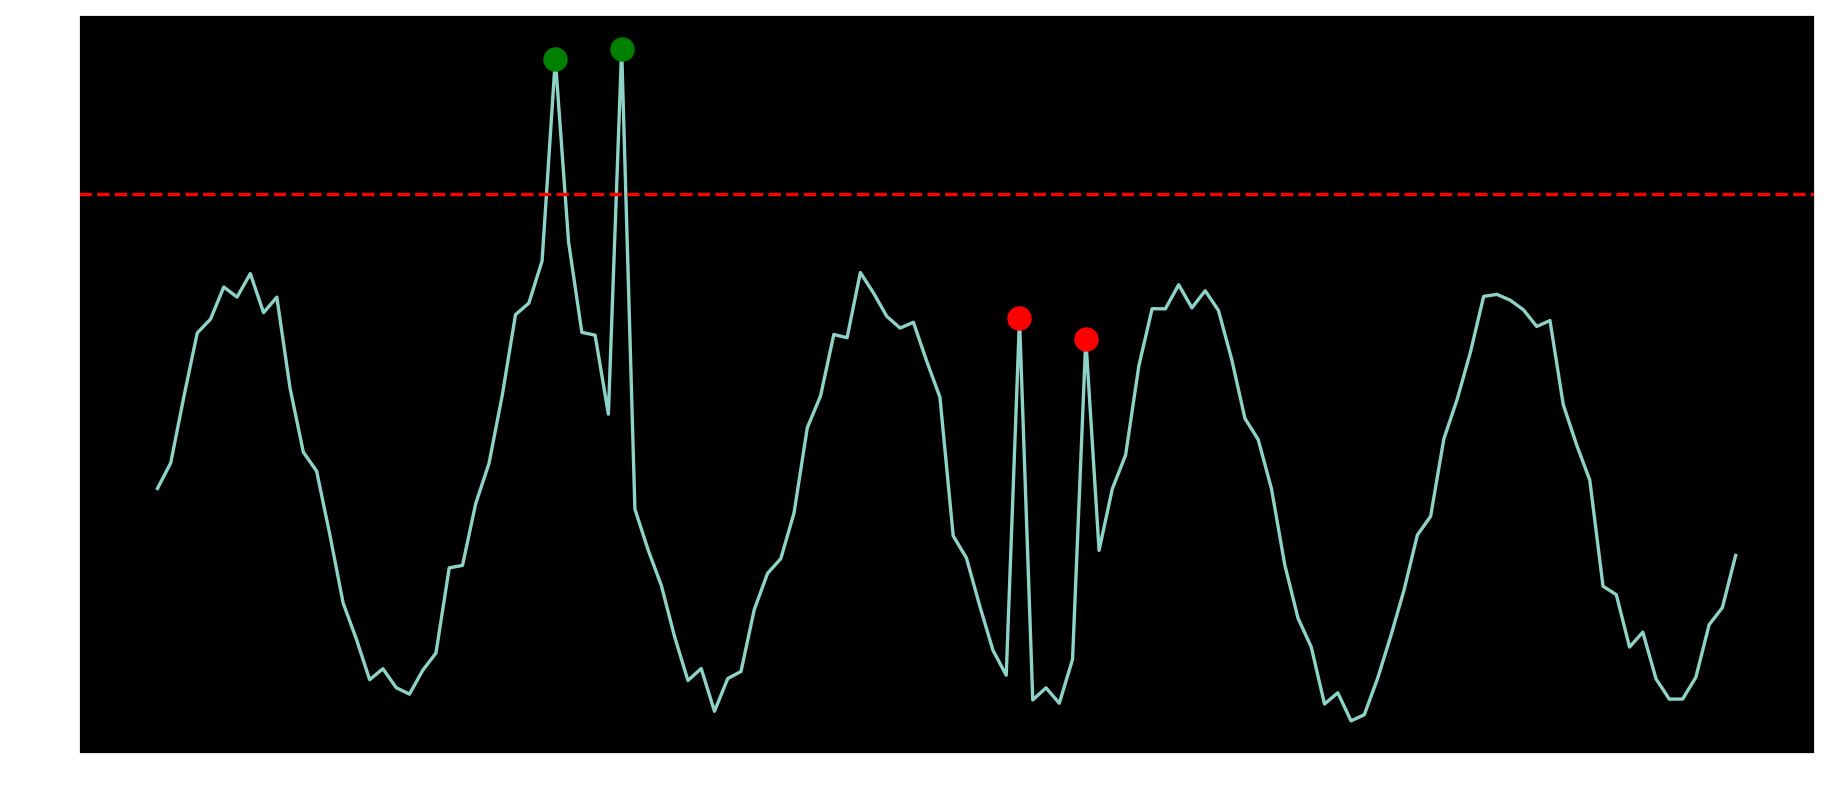
It is possible now to apply statistical threshold on it.
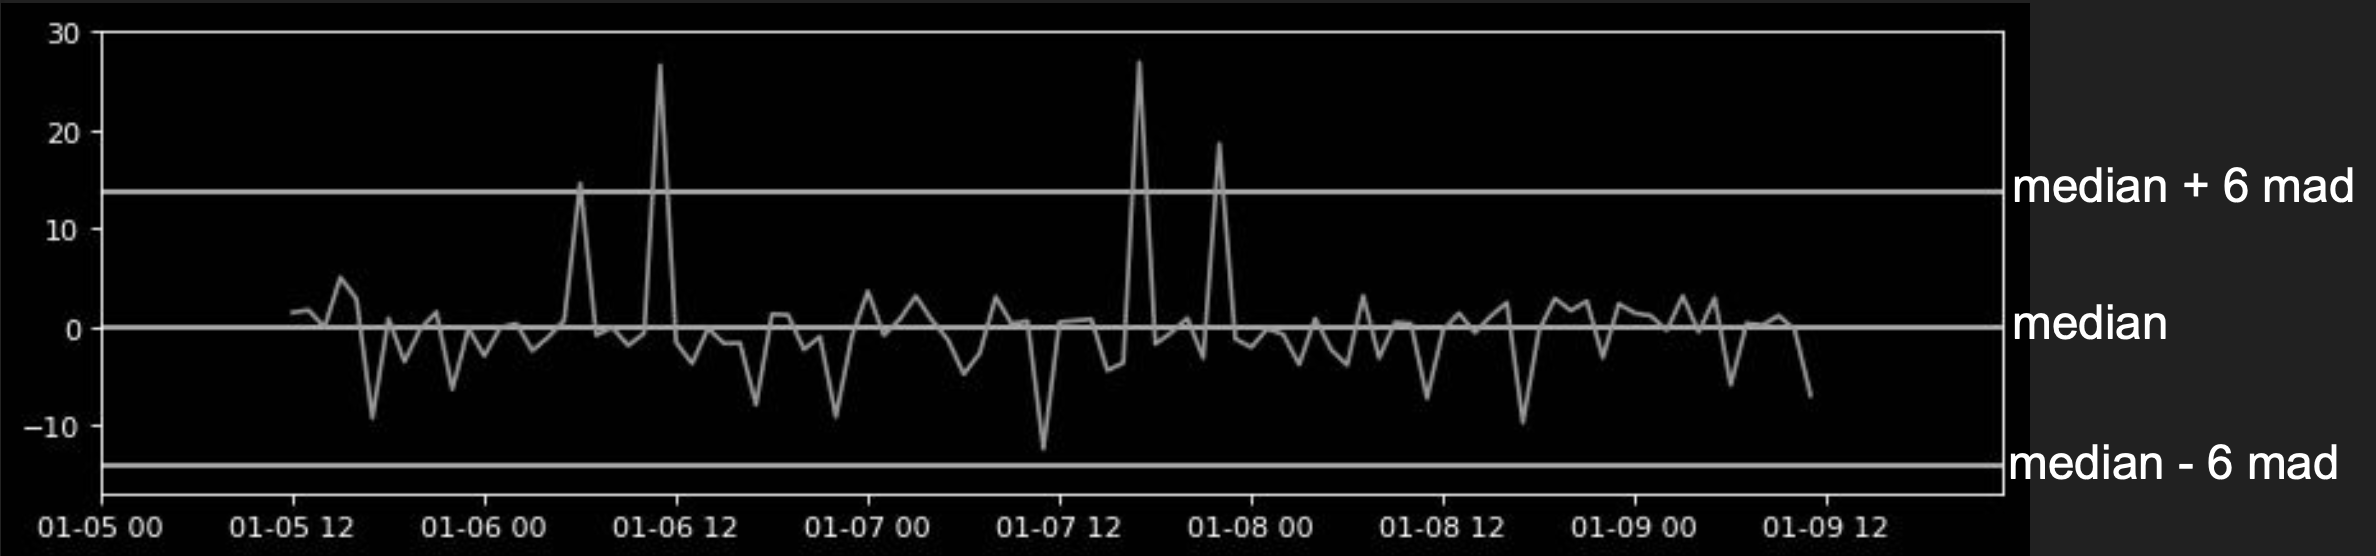
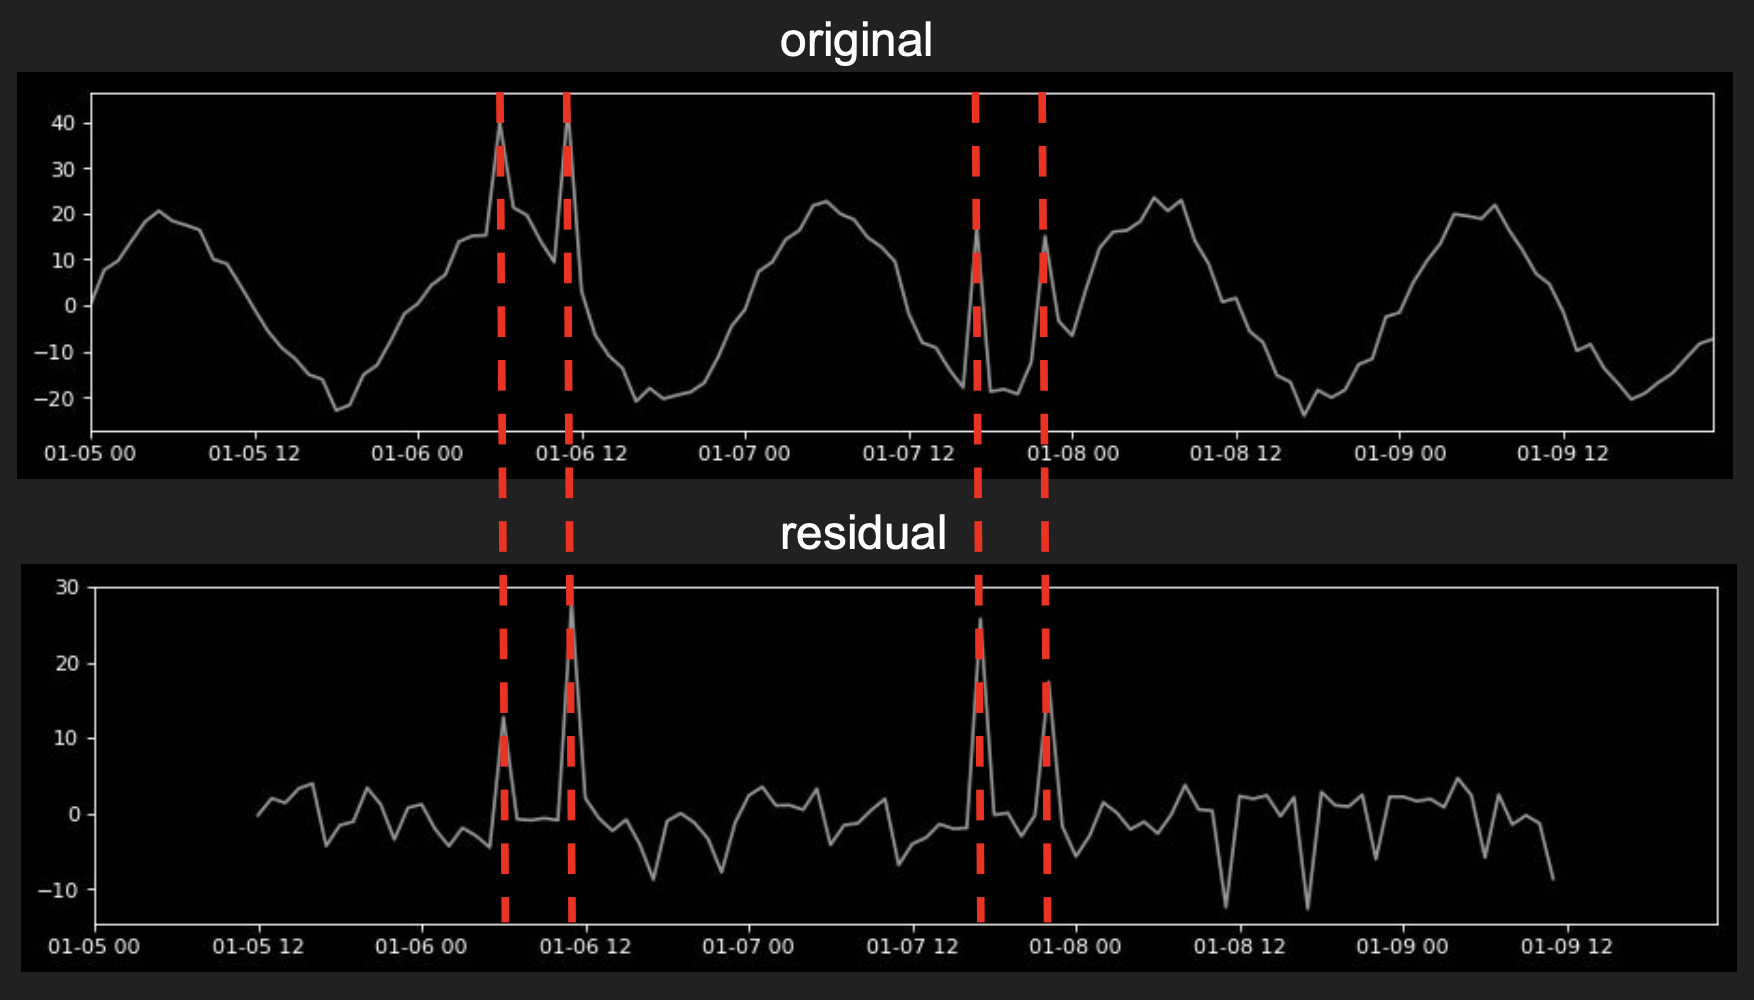
With the threshold, it is now possible to identify anomalies.
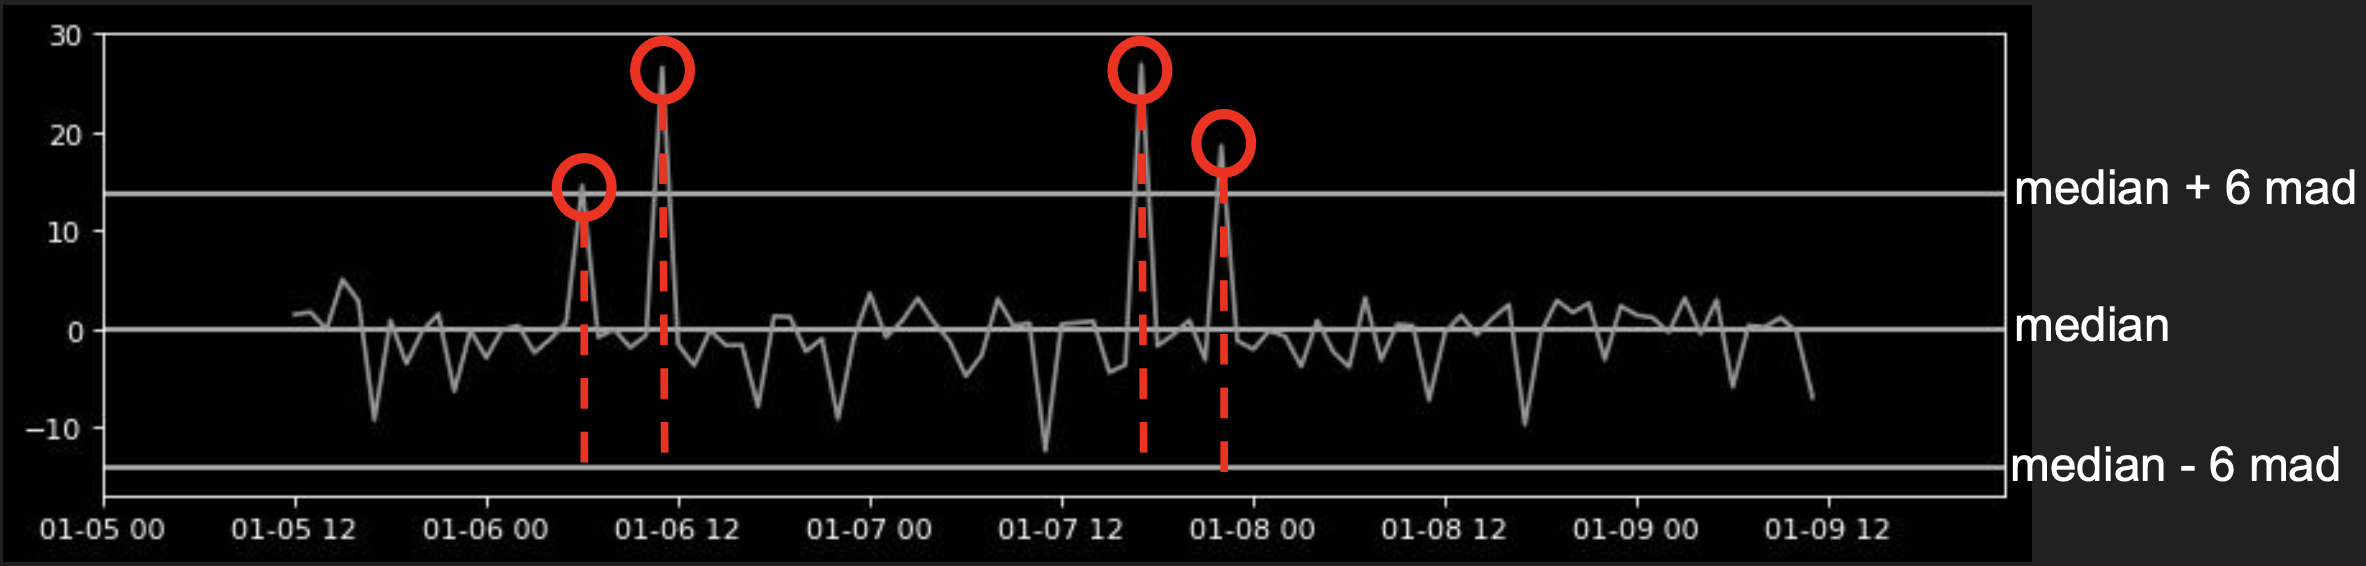
Mapping the anomalies found in residual back to the original signal identifies all data points of interest, it can be observed how the identified datapoints match the anomalies.
Pros:
- Works well with seasonal time series - global and local anomalies [cite: 25]
- Few parameters to optimize (compared to other models) [cite: 25]
- Algorithm implementation is simple given statistics libraries as available [cite: 25]
Cons:
- Need to know how to adjust period parameter for each time series [cite: 25]
- Need to know how to adjust anomaly factor so to avoid noisy results [cite: 25]
- Works only for seasonal time series where residual is a normal distribution [cite: 25]
References / Q&A
- Notebook Demo - https://github.com/hcmarchezi/jupyter_notebooks/blob/master/residual_extraction_demo_1.ipynb
- Twitter Anomaly Detection - https://github.com/twitter/AnomalyDetection
- Automatic Anomaly Detection in the Cloud Via Statistical Learning - https://arxiv.org/pdf/1704.07706.pdf
- Generalized ESD for Outliers - https://www.itl.nist.gov/div898/handbook/eda/section3/eda35h3.htm
- Real Time Anomaly Detection System for Time Series at Scale - http://proceedings.mlr.press/v71/toledano18a/toledano18a.pdf
- Time Series Dataset - https://datamarket.com/data/